# X-Road: Environmental Monitoring Architecture
Version: 1.9
Doc. ID: ARC-ENVMON
| Date | Version | Description | Author |
|---|---|---|---|
| 15.12.2015 | 1.0 | Initial version | Ilkka Seppälä |
| 04.01.2017 | 1.1 | Fix documentation links | Ilkka Seppälä |
| 20.01.2017 | 1.2 | Added license text, table of contents and version history | Sami Kallio |
| 23.2.2017 | 1.3 | Added reference to the Security Server targeting extension and moved the modified X-Road protocol details there | Olli Lindgren |
| 18.8.2017 | 1.4 | Added details about the security server certificates monitoring data | Olli Lindgren |
| 18.10.2017 | 1.5 | Joni Laurila | |
| 02.03.2018 | 1.6 | Added numbering, terms document references, removed unnecessary anchors | Tatu Repo |
| 20.01.2020 | 1.7 | Update XroadProcessLister description | Jarkko Hyöty |
| 25.06.2020 | 1.8 | Add chapter 2.2.1 JMX interface | Petteri Kivimäki |
| 01.06.2023 | 1.9 | Update references | Petteri Kivimäki |
# Table of Contents
# License
This document is licensed under the Creative Commons Attribution-ShareAlike 3.0 Unported License. To view a copy of this license, visit http://creativecommons.org/licenses/by-sa/3.0/.
# 1 Overview
X-Road monitoring is conceptually split into two parts: environmental and operational monitoring:
- Environmental monitoring is the monitoring of the X-Road environment: details of the security servers such as operating system, memory, disk space, CPU load, running processes and installed packages, etc.
- Operational monitoring is the monitoring of operational statistics such as which services have been called, how many times, what is the average response time, etc.
This document describes environmental monitoring architecture.
# 1.1 Terms and abbreviations
See X-Road terms and abbreviations documentation [TA-TERMS].
# 1.2 References
| Document ID | |
|---|---|
| PR-GCONF | X-Road: Protocol for Downloading Configuration |
| UC-GCONF | X-Road: Use Case Model for Global Configuration Distribution |
| PR-MESS | X-Road: Message Protocol v4.0 |
| PR-TARGETSS | Security Server targeting extension for the X-Road message protocol |
| TA-TERMS | X-Road Terms and Abbreviations |
# 2 Components

# 2.1 Monitoring metaservice (proxymonitor add-on)
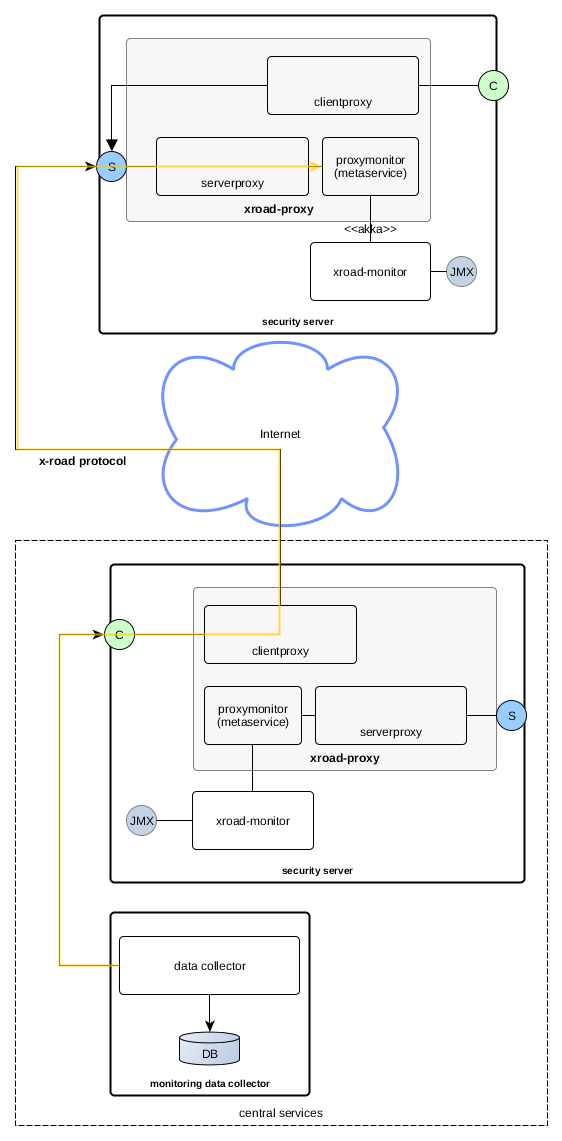
Monitoring metaservice responds to queries for monitoring data from security server's serverproxy interface. This metaservice requests the current monitoring data from local monitoring service, using Akka (opens new window). Monitoring metaservice translates the monitoring data to a SOAP XML response.
Monitoring service handles authorization of the requests, see Access control. It reads monitoring configuration from distributed global monitoring configuration (see UC-GCONF, PR-GCONF).
Monitoring metaservice is installed as a proxy add-on, with name xroad-addon-proxymonitor.
# 2.2 Monitoring service (xroad-monitor)
Monitoring service is responsible for collecting the monitoring data from one security server instance. It distributes the collected data to monitoring clients (normally the local monitoring metaservice) when requested through an Akka interface.
Monitoring service uses several sensors to collect the data. Sensors and related functionalities are build on top of Dropwizard Metrics (opens new window).
The following sensors produce monitoring data:
SystemMetricsSensor- data:
- system CPU load percentage (0-100)
- free memory
- total memory
- free swap space
- total swap space
- open file descriptor count
- maximum file descriptor count
- committed virtual memory
- metrics are collected from UnixOperatingSystemMXBean (opens new window)
- data is refreshed every 5 seconds and analyzed in a 60s sliding window (for min/max/average/etc values)
- data:
DiskSpaceSensor- data: total and free disk space for all filesystem roots
- data is refreshed once per minute
OsInfoLister- data: operating system information from
/proc/version - for example
Linux version 3.13.0-70-generic (buildd@lgw01-34) (gcc version 4.8.2 (Ubuntu 4.8.2-19ubuntu1) ) #113-Ubuntu SMP Mon Nov 16 18:34:13 UTC 2015 - data is refreshed once per minute
- data: operating system information from
ProcessLister- data: list of running processes from command
ps -aew -o user,pcpu,start_time,pmem,pid,comm - data is refreshed once per minute
- data: list of running processes from command
XroadProcessLister- data: like ProcessLister, but lists only java processes running as the
xroaduser and includes full command with arguments - data is refreshed once per minute
- data: like ProcessLister, but lists only java processes running as the
PackageLister- data: list of installed packages and their versions
- data is refreshed once per minute
CertificateInfoSensor- data: information about certificates associated with this security server
- certificate SHA-1 hash
- validity period: not before (ISO 8601 date)
- validity period: not after (ISO 8601 date)
- the type of the certificate:
AUTH_OR_SIGNfor the Security Server member certificates (for signing) and the Security Server certificate (for authentication)INTERNAL_IS_CLIENT_TLSfor the client Information system certificatesSECURITY_SERVER_TLSfor the TLS certificate of the Security server
- is the certificate active (true/false)
- data is refreshed once per day
- data: information about certificates associated with this security server
Monitoring service is installed as a separate package, with name xroad-monitor. It runs in a separate process.
# 2.2.1 JMX interface
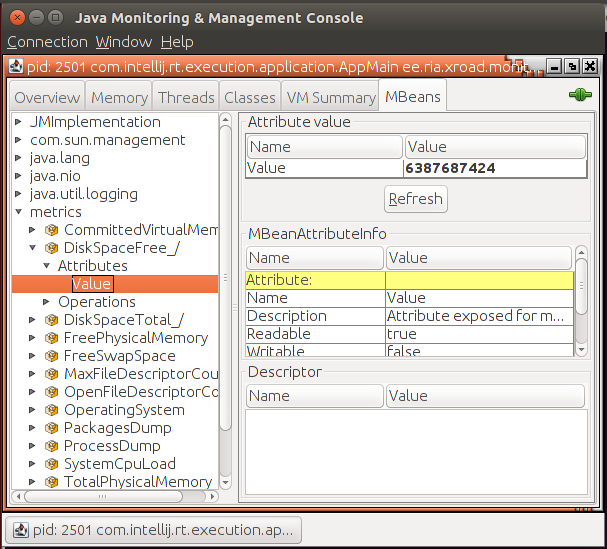
The service also publishes the monitoring data via JMX. Local monitoring agents can use this as an alternative way to fetch monitoring data. With the default configuration, JMX is disabled.

JMX is enabled by adding the required configuration in /etc/xroad/services/local.properties file. The file is opened for editing and changes are made on the XROAD_MONITOR_PARAMS variable value. After the XROAD_MONITOR_PARAMS variable value has been updated, the xroad-monitor service must be restarted.
The example configuration below enables JMX, binds it to port 9999 on any available interface with SSL and password authentication enabled:
XROAD_MONITOR_PARAMS=-Djava.rmi.server.hostname=0.0.0.0 -Dcom.sun.management.jmxremote.port=9999 -Dcom.sun.management.jmxremote.authenticate=true -Dcom.sun.management.jmxremote.ssl=true
# 2.3 Central monitoring client
Central monitoring client is a specific security server, which has been granted access to query monitoring data from other security servers. See Access control. The identity of this security server is configured using central server's admin user interface.
# 2.4 Central monitoring data collector
Central monitoring data collector is responsible for collecting monitoring data from all the security servers. It does this by executing monitoring requests through the central monitoring client to all known security server instances. Data collector stores the data in some permanent storage, where it can be analyzed.
Data collector has not been implemented yet.
# 2.5 Central server admin user interface
Identity of central monitoring client (if any) is configured using central server's admin user interface. Configuration is done by updating a specific optional configuration file (see UC-GCONF, "UC GCONF_05: Upload an Optional Configuration Part File") monitoring-params.xml. This configuration file is distributed to all security servers through the global configuration distribution process (see UC-GCONF, "UC GCONF_24: Download Configuration from a Configuration Source")
<tns:conf xmlns:id="http://x-road.eu/xsd/identifiers"
          xmlns:tns="http://x-road.eu/xsd/xroad.xsd"
          xmlns:xsi="http://www.w3.org/2001/XMLSchema-instance"
          xsi:schemaLocation="http://x-road.eu/xsd/xroad.xsd">
    <monitoringClient>
        <monitoringClientId id:objectType="SUBSYSTEM">
            <id:xRoadInstance>fdev</id:xRoadInstance>
            <id:memberClass>GOV</id:memberClass>
            <id:memberCode>1710128-9</id:memberCode>
            <id:subsystemCode>LIPPIS</id:subsystemCode>
        </monitoringClientId>
    </monitoringClient>
</tns:conf>
One can configure either one member or a member's subsystem to be the central monitoring client. Permission to execute monitoring queries is strictly limited to that single member or subsystem - defining one subsystem to be a monitoring client does not grant the corresponding member access to querying monitoring data (and vice versa).
The optional configuration for monitoring parameters is taken into use by installing package xroad-centralserver-monitoring. This package also includes the components that validate the updated xml monitoring configuration.
To disable central monitoring client altogether, update configuration to one which has no client:
<tns:conf xmlns:id="http://x-road.eu/xsd/identifiers"
          xmlns:tns="http://x-road.eu/xsd/xroad.xsd"
          xmlns:xsi="http://www.w3.org/2001/XMLSchema-instance"
          xsi:schemaLocation="http://x-road.eu/xsd/xroad.xsd">
    <monitoringClient>
    </monitoringClient>
</tns:conf>
# 3 Monitoring in action
# 3.1 Pull messaging model
Currently central monitoring data collection is done using pull messaging model. Here, pull means that the central monitoring client sends requests to the individual security servers.
An alternative to this would be model where security servers periodically push (send) the monitoring data to central monitoring client.
To support clustered configurations, monitoring queries use an extended X-Road message protocol.
# 3.2 Using an extension of the X-Road message protocol
Fetching security server metrics uses the X-Road protocol. The original X-Road message protocol version 4.0 (described in PR-MESS) had header element service to define the recipient of a message.
<SOAP-ENV:Envelope
xmlns:SOAP-ENV="http://schemas.xmlsoap.org/soap/envelope/"
xmlns:xrd="http://x-road.eu/xsd/xroad.xsd"
xmlns:id="http://x-road.eu/xsd/identifiers"
xmlns:prod="http://vrk-test.x-road.fi/producer">
   <SOAP-ENV:Header>
      <xrd:protocolVersion>4.0</xrd:protocolVersion>
      <xrd:id>1234</xrd:id>
      <xrd:userId>EE1234567890</xrd:userId>
      <xrd:client id:objectType="MEMBER">
         <id:xRoadInstance>fdev</id:xRoadInstance>
         <id:memberClass>GOV</id:memberClass>
         <id:memberCode>1710128-9</id:memberCode>
      </xrd:client>
      <xrd:service id:objectType="SERVICE">
         <id:xRoadInstance>fdev</id:xRoadInstance>
         <id:memberClass>GOV</id:memberClass>
         <id:memberCode>1710128-9</id:memberCode>
         <id:serviceCode>getRandom</id:serviceCode>
         <id:serviceVersion>v1</id:serviceVersion>
      </xrd:service>
   </SOAP-ENV:Header>
   <SOAP-ENV:Body>
      <prod:getRandom></prod:getRandom>
   </SOAP-ENV:Body>
</SOAP-ENV:Envelope>
For monitoring queries this is not enough. In a clustered security server configuration, one service can be served from multiple security servers. When X-Road routes the message, it picks one candidate based on which one answers the quickest. When executing monitoring queries, we need to be able to fetch monitoring data from a specific security server in a cluster. To make this possible the Security server targeting extension for the X-Road message protocol [PR-TARGETSS] is used, which adds a new SOAP header element securityServer. Using this element, the caller identifies which security server should respond with the monitoring data (servercode = fdev-ss1.i.palveluvayla.com). To execute a query, we call service getSecurityServerMetrics:
<SOAP-ENV:Envelope
	xmlns:SOAP-ENV="http://schemas.xmlsoap.org/soap/envelope/"
	xmlns:id="http://x-road.eu/xsd/identifiers"
	xmlns:xrd="http://x-road.eu/xsd/xroad.xsd"
	xmlns:m="http://x-road.eu/xsd/monitoring">
    <SOAP-ENV:Header>
        <xrd:client id:objectType="MEMBER">
            <id:xRoadInstance>fdev</id:xRoadInstance>
            <id:memberClass>GOV</id:memberClass>
            <id:memberCode>1710128-9</id:memberCode>
        </xrd:client>
        <xrd:service id:objectType="SERVICE">
            <id:xRoadInstance>fdev</id:xRoadInstance>
            <id:memberClass>GOV</id:memberClass>
            <id:memberCode>1710128-9</id:memberCode>
            <id:serviceCode>getSecurityServerMetrics</id:serviceCode>
        </xrd:service>
        <xrd:securityServer id:objectType="SERVER">
            <id:xRoadInstance>fdev</id:xRoadInstance>
            <id:memberClass>GOV</id:memberClass>
            <id:memberCode>1710128-9</id:memberCode>
            <id:serverCode>fdev-ss1.i.palveluvayla.com</id:serverCode>
        </xrd:securityServer>
        <xrd:id>ID11234</xrd:id>
        <xrd:protocolVersion>4.0</xrd:protocolVersion>
    </SOAP-ENV:Header>
    <SOAP-ENV:Body>
        <m:getSecurityServerMetrics/>
    </SOAP-ENV:Body>
</SOAP-ENV:Envelope>
The response looks like:
<SOAP-ENV:Envelope
    xmlns:SOAP-ENV="http://schemas.xmlsoap.org/soap/envelope/"
    xmlns:id="http://x-road.eu/xsd/identifiers"
    xmlns:m="http://x-road.eu/xsd/monitoring"
    xmlns:xrd="http://x-road.eu/xsd/xroad.xsd">
   <SOAP-ENV:Header>
      <xrd:client id:objectType="MEMBER">
         <id:xRoadInstance>fdev</id:xRoadInstance>
         <id:memberClass>GOV</id:memberClass>
         <id:memberCode>1710128-9</id:memberCode>
      </xrd:client>
      <xrd:service id:objectType="SERVICE">
         <id:xRoadInstance>fdev</id:xRoadInstance>
         <id:memberClass>GOV</id:memberClass>
         <id:memberCode>1710128-9</id:memberCode>
         <id:serviceCode>getSecurityServerMetrics</id:serviceCode>
      </xrd:service>
      <xrd:securityServer id:objectType="SERVER">
         <id:xRoadInstance>fdev</id:xRoadInstance>
         <id:memberClass>GOV</id:memberClass>
         <id:memberCode>1710128-9</id:memberCode>
         <id:serverCode>fdev-ss1.i.palveluvayla.com</id:serverCode>
      </xrd:securityServer>
      <xrd:id>ID11234</xrd:id>
      <xrd:protocolVersion>4.0</xrd:protocolVersion>
      <xrd:requestHash algorithmId="http://www.w3.org/2001/04/xmlenc#sha512">mChpBRMvFlBBSNKeOxAJQBw4r6XdHZFuH8BOzhjsxjjOdaqXXyPXwnDEdq/NkYfEqbLUTi1h/OHEnX9F5YQ5kQ==</xrd:requestHash>
   </SOAP-ENV:Header>
   <SOAP-ENV:Body>
      <m:getSecurityServerMetricsResponse>
         <m:metricSet>
            <m:name>SERVER:fdev/GOV/1710128-9/fdev-ss1.i.palveluvayla.com</m:name>
            <m:stringMetric>
               <m:name>proxyVersion</m:name>
               <m:value>6.7.7-1.20151201075839gitb72b28e</m:value>
            </m:stringMetric>
            <m:metricSet>
               <m:name>systemMetrics</m:name>
               <m:stringMetric>
                  <m:name>OperatingSystem</m:name>
                  <m:value>Linux version 3.13.0-70-generic</m:value>
               </m:stringMetric>
               <m:numericMetric>
                  <m:name>TotalPhysicalMemory</m:name>
                  <m:value>2097684480</m:value>
               </m:numericMetric>
               <m:numericMetric>
                  <m:name>TotalSwapSpace</m:name>
                  <m:value>2097684480</m:value>
               </m:numericMetric>
            </m:metricSet>
            ...
         </m:metricSet>
      </m:getSecurityServerMetricsResponse>
   </SOAP-ENV:Body>
</SOAP-ENV:Envelope>
The schema for the monitoring response is defined in monitoring.xsd:
<?xml version="1.0" encoding="UTF-8"?>
<schema xmlns="http://www.w3.org/2001/XMLSchema"
        xmlns:tns="http://x-road.eu/xsd/monitoring" xmlns:xs="http://www.w3.org/2001/XMLSchema"
        targetNamespace="http://x-road.eu/xsd/monitoring"
        elementFormDefault="qualified">
    <xs:complexType name="MetricType" abstract="true">
        <xs:sequence>
            <xs:element name="name" type="xs:string"/>
        </xs:sequence>
    </xs:complexType>
    <xs:complexType name="NumericMetricType">
        <xs:complexContent>
            <xs:extension base="tns:MetricType">
                <xs:sequence>
                    <xs:element name="value" type="xs:decimal"/>
                </xs:sequence>
            </xs:extension>
        </xs:complexContent>
    </xs:complexType>
    <xs:complexType name="StringMetricType">
        <xs:complexContent>
            <xs:extension base="tns:MetricType">
                <xs:sequence>
                    <xs:element name="value" type="xs:string"/>
                </xs:sequence>
            </xs:extension>
        </xs:complexContent>
    </xs:complexType>
    <xs:complexType name="HistogramMetricType">
        <xs:complexContent>
            <xs:extension base="tns:MetricType">
                <xs:sequence>
                    <xs:element name="updated" type="xs:dateTime"/>
                    <xs:element name="min" type="xs:decimal"/>
                    <xs:element name="max" type="xs:decimal"/>
                    <xs:element name="mean" type="xs:decimal"/>
                    <xs:element name="median" type="xs:decimal"/>
                    <xs:element name="stddev" type="xs:decimal"/>
                </xs:sequence>
            </xs:extension>
        </xs:complexContent>
    </xs:complexType>
    <xs:complexType name="MetricSetType">
        <xs:complexContent>
            <xs:extension base="tns:MetricType">
                <xs:sequence>
                    <xs:choice maxOccurs="unbounded">
                        <xs:element name="metricSet" type="tns:MetricSetType"/>
                        <xs:element name="numericMetric" type="tns:NumericMetricType"/>
                        <xs:element name="stringMetric" type="tns:StringMetricType"/>
                        <xs:element name="histogramMetric" type="tns:HistogramMetricType"/>
                    </xs:choice>
                </xs:sequence>
            </xs:extension>
        </xs:complexContent>
    </xs:complexType>
    <xs:element name="getSecurityServerMetricsResponse">
        <xs:complexType>
            <xs:sequence>
                <xs:element name="metricSet" type="tns:MetricSetType"/>
            </xs:sequence>
        </xs:complexType>
    </xs:element>
</schema>
# 3.3 Access control
Monitoring queries are allowed from
- client that is the owner of the security server
- central monitoring client (if any have been configured)
Central monitoring client is configured using central server admin user interface, see Admin user interface.
Attempts to query monitoring data from other clients results in an AccessDenied -error.
JMX API, in case port and network access is enabled, will provide monitoring data directly without access control checks by security server.
# 3.3.1 Limiting central monitoring client access for environmental monitor data
Request for monitor data can be set for limiting optional parts by changing env-monitor.limit-remote-data-set parameter. By limiting data set environmental monitoring will return only proxyVersion, OperatingSystem and Certificate information.
If request parameters are used and flag is set for limiting, response will include proxyVersion, name and OperatingSystem and/or Certificate information if they are in parameter list and nothing else.
